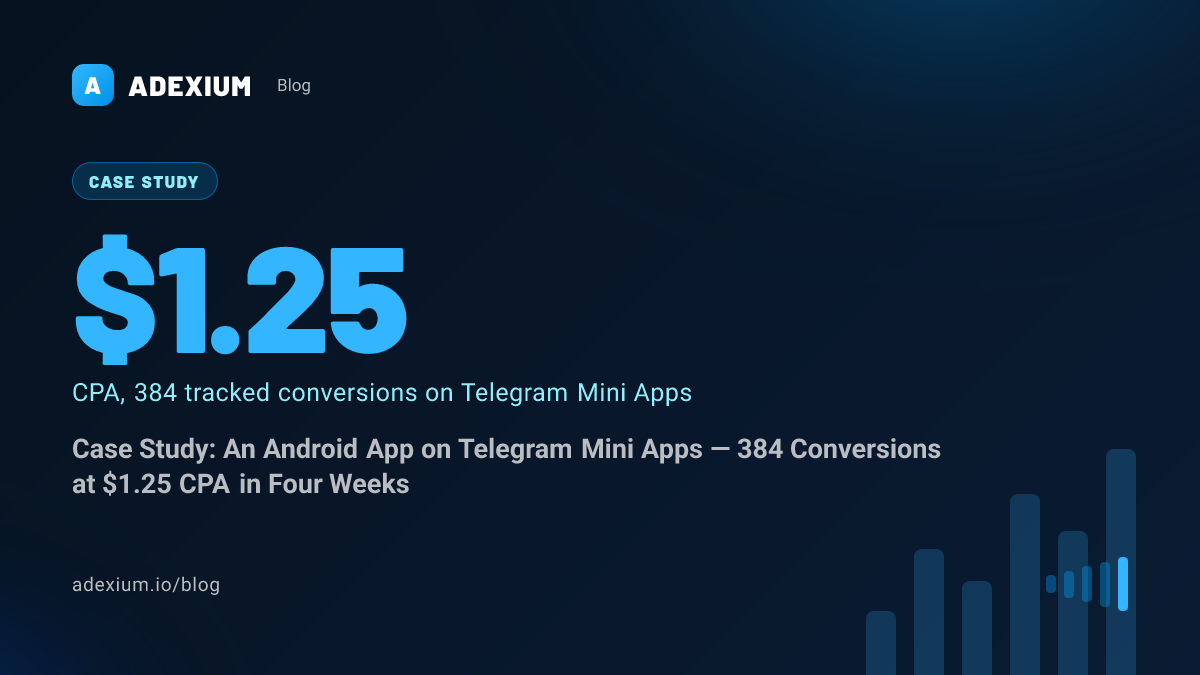
This is a small, clean campaign, and that is why it is useful. One advertiser, one product, one format, a flat bid, four weeks, every conversion tracked by postback. Nothing was optimized automatically, so the numbers show what Telegram Mini App traffic does on its own.
The product is an Android video app published on Google Play. The advertiser promoted it with short video creatives inside partner Telegram Mini Apps, in the United States and Germany.
The setup
| Setting | Value |
|---|---|
| Format | Telegram Mini Apps |
| Creatives | 3 short videos per campaign |
| Geos | United States (one campaign), Germany (one campaign) |
| Bid | Flat CPM $3.20, no Auto CPA |
| Frequency cap | 2 impressions per user per day |
| Daily budgets | $30 (US), $20 (DE) |
| Conversion event | Defined by the advertiser, sent by S2S postback with our click ID |
| Period | October 1–28, 2026 (UTC) |
The conversion is the advertiser’s own event. We do not see what the app counts — install, first launch or sign-up — only that the postback arrives, on median about a minute after the click. Treat the CPA below as “cost per advertiser-defined conversion”, not as cost per paying user.
The result
| Campaign | Spend | Impressions | Clicks | CTR | Conversions | Click → conversion | CPC | CPA |
|---|---|---|---|---|---|---|---|---|
| United States | $300.37 | 93,867 | 12,338 | 13.14% | 236 | 1.91% | $0.024 | $1.27 |
| Germany | $180.86 | 56,520 | 9,362 | 16.56% | 148 | 1.58% | $0.019 | $1.22 |
| Total | $481.24 | 150,387 | 21,700 | 14.43% | 384 | 1.77% | $0.022 | $1.25 |
Dashboard views below show the campaigns’ production numbers for October 1–28, 2026 in the advertiser Analytics page; campaign names and the account balance are blurred.
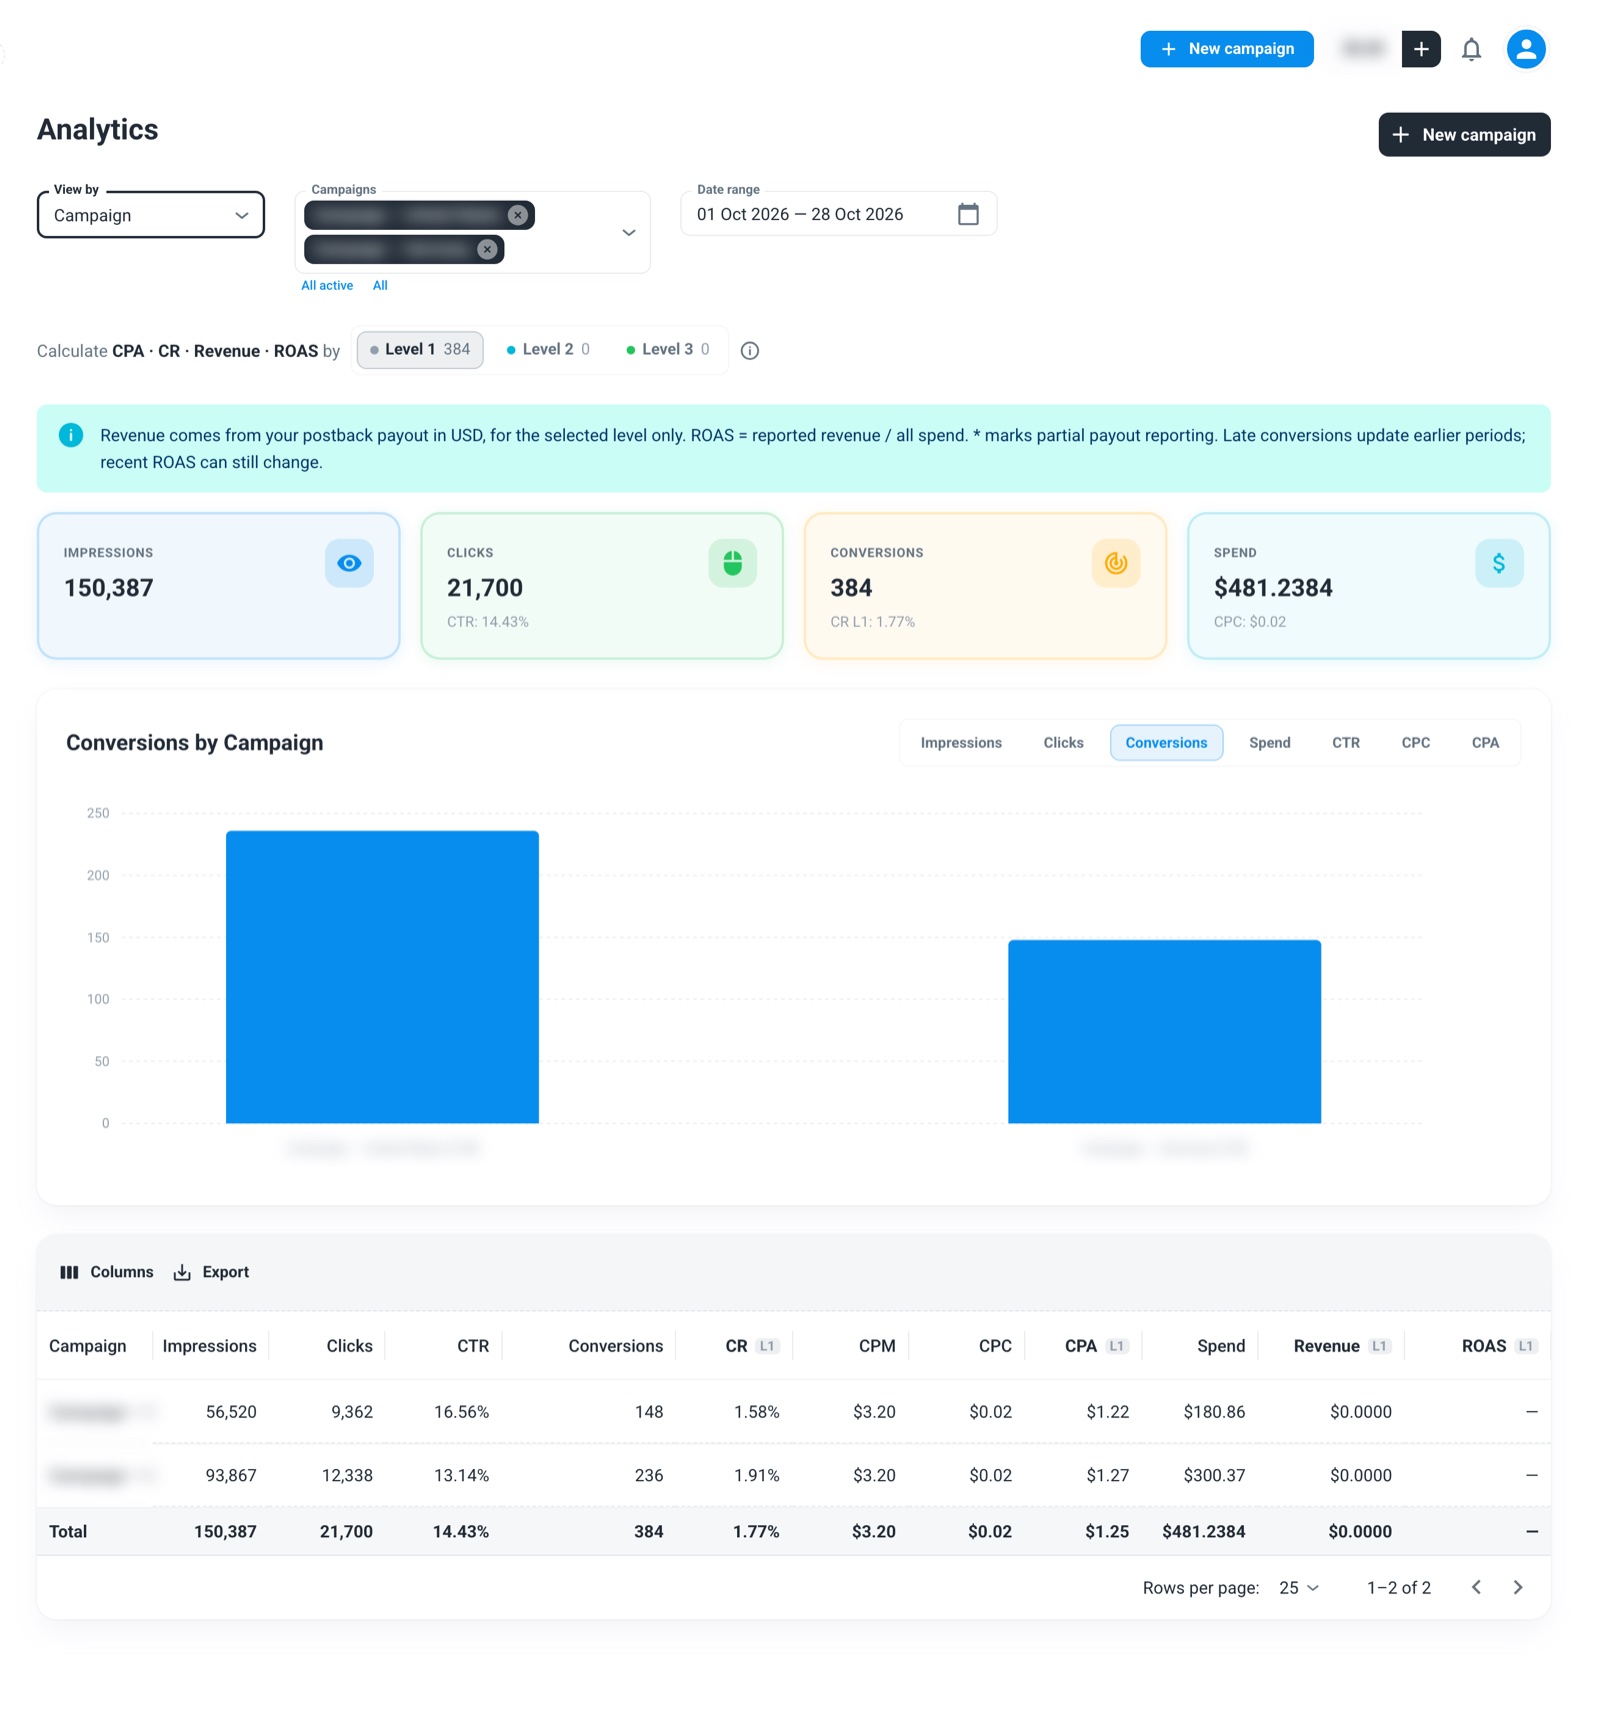 Advertiser dashboard, Analytics by campaign: October 1–28, 2026, campaign names blurred.
Two things stand out. The click-through rate is 14%: a video ad inside a Mini App gets attention that a banner on a web page does not. And the two countries land within five cents of each other on CPA, even though the US campaign pays more per click: US users who clicked converted more often.
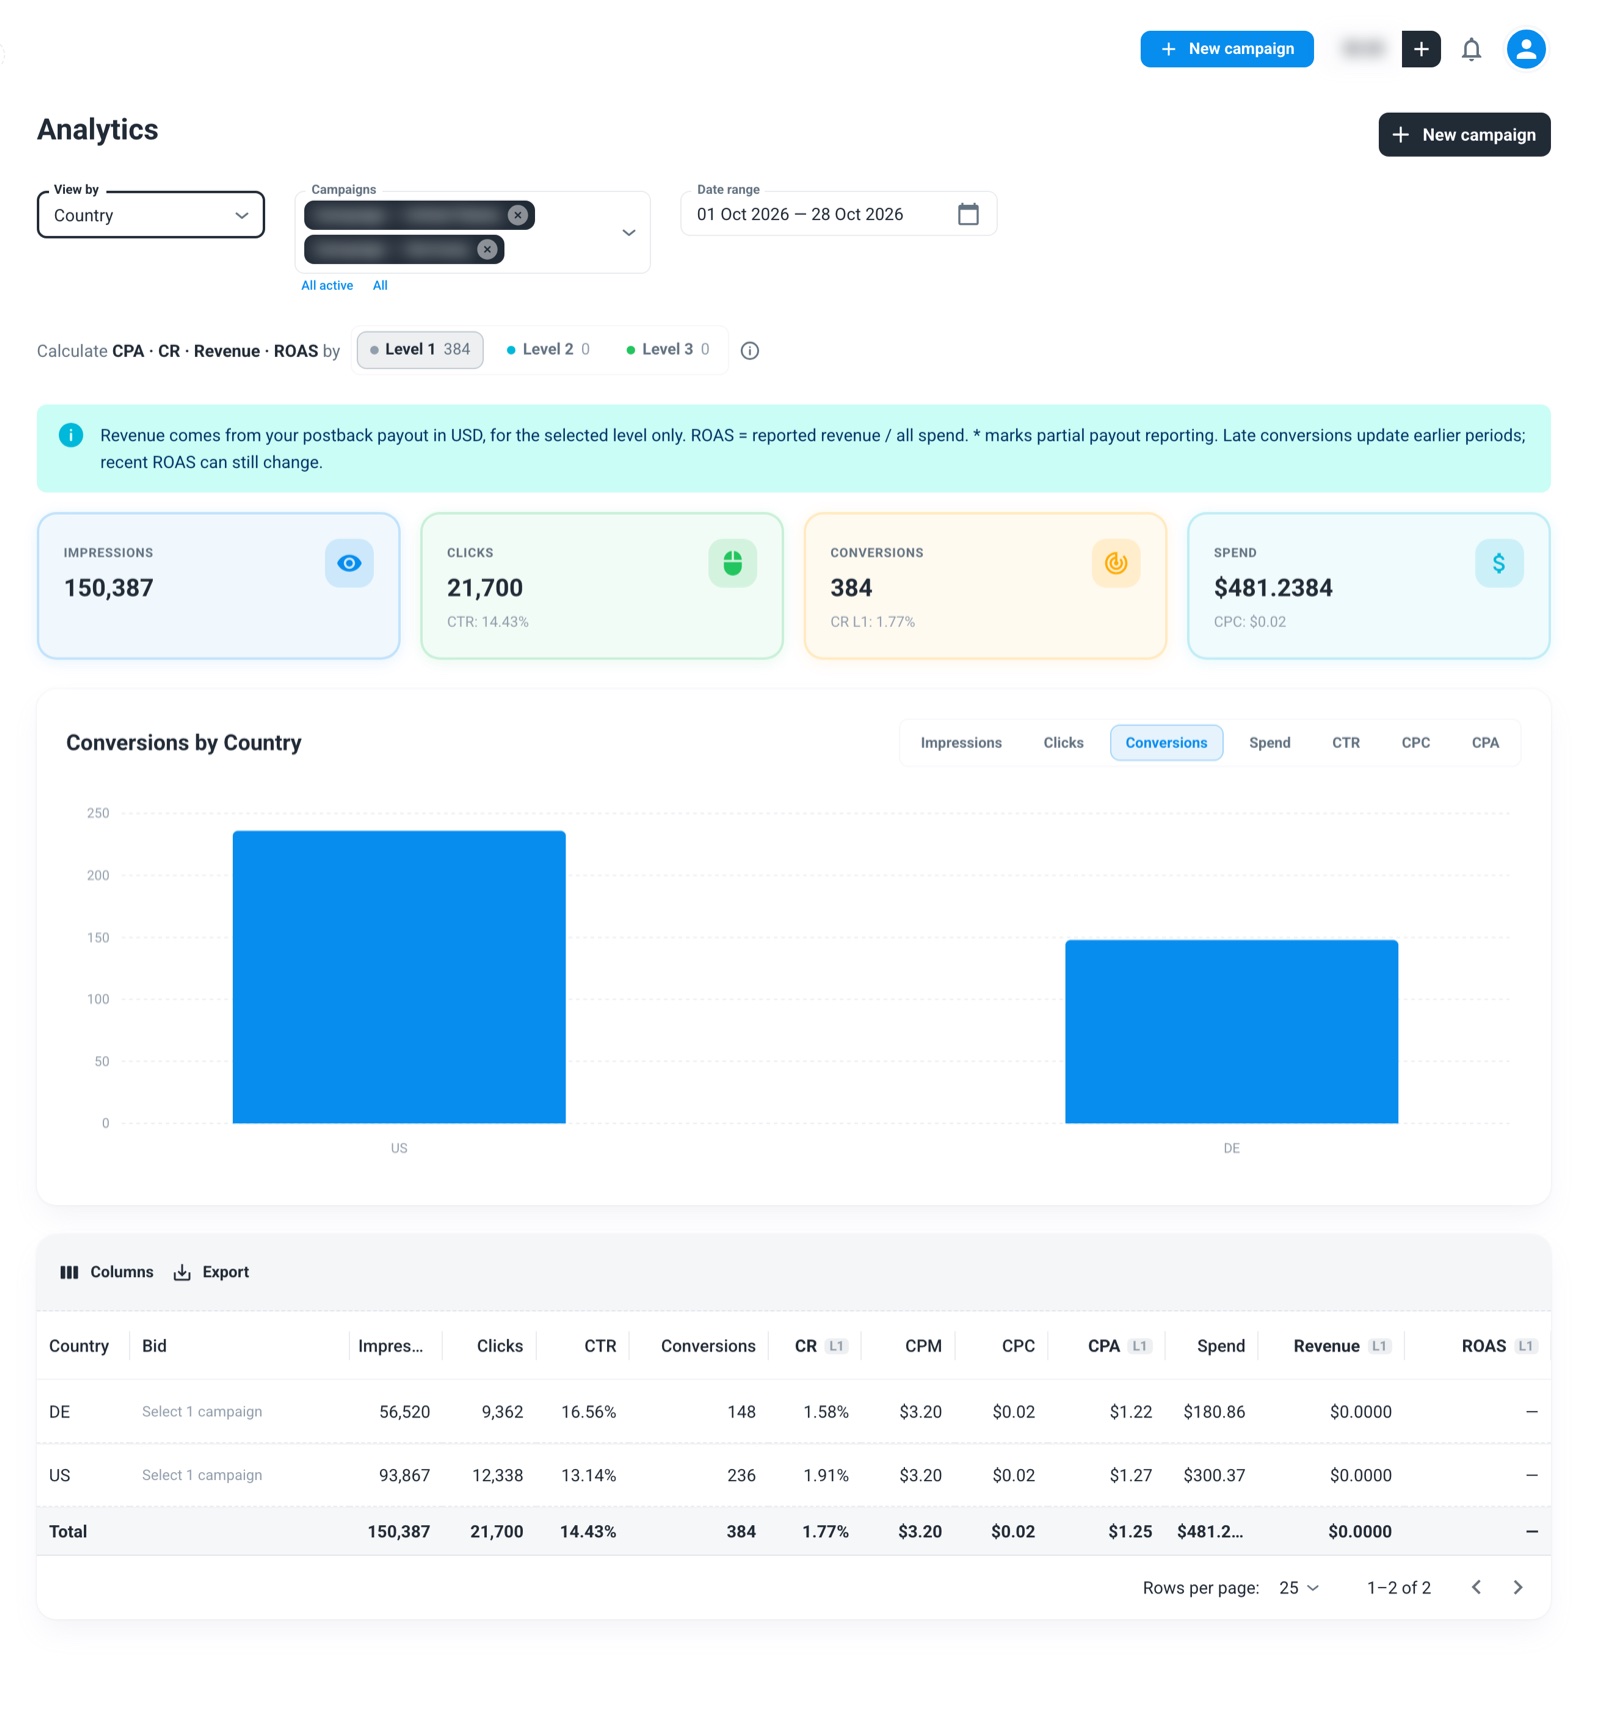 Analytics by country: United States and Germany, October 1–28, 2026.
Week by week: what actually moves CPA
Spend grew more than tenfold over the month with the bid unchanged at $3.20 CPM.
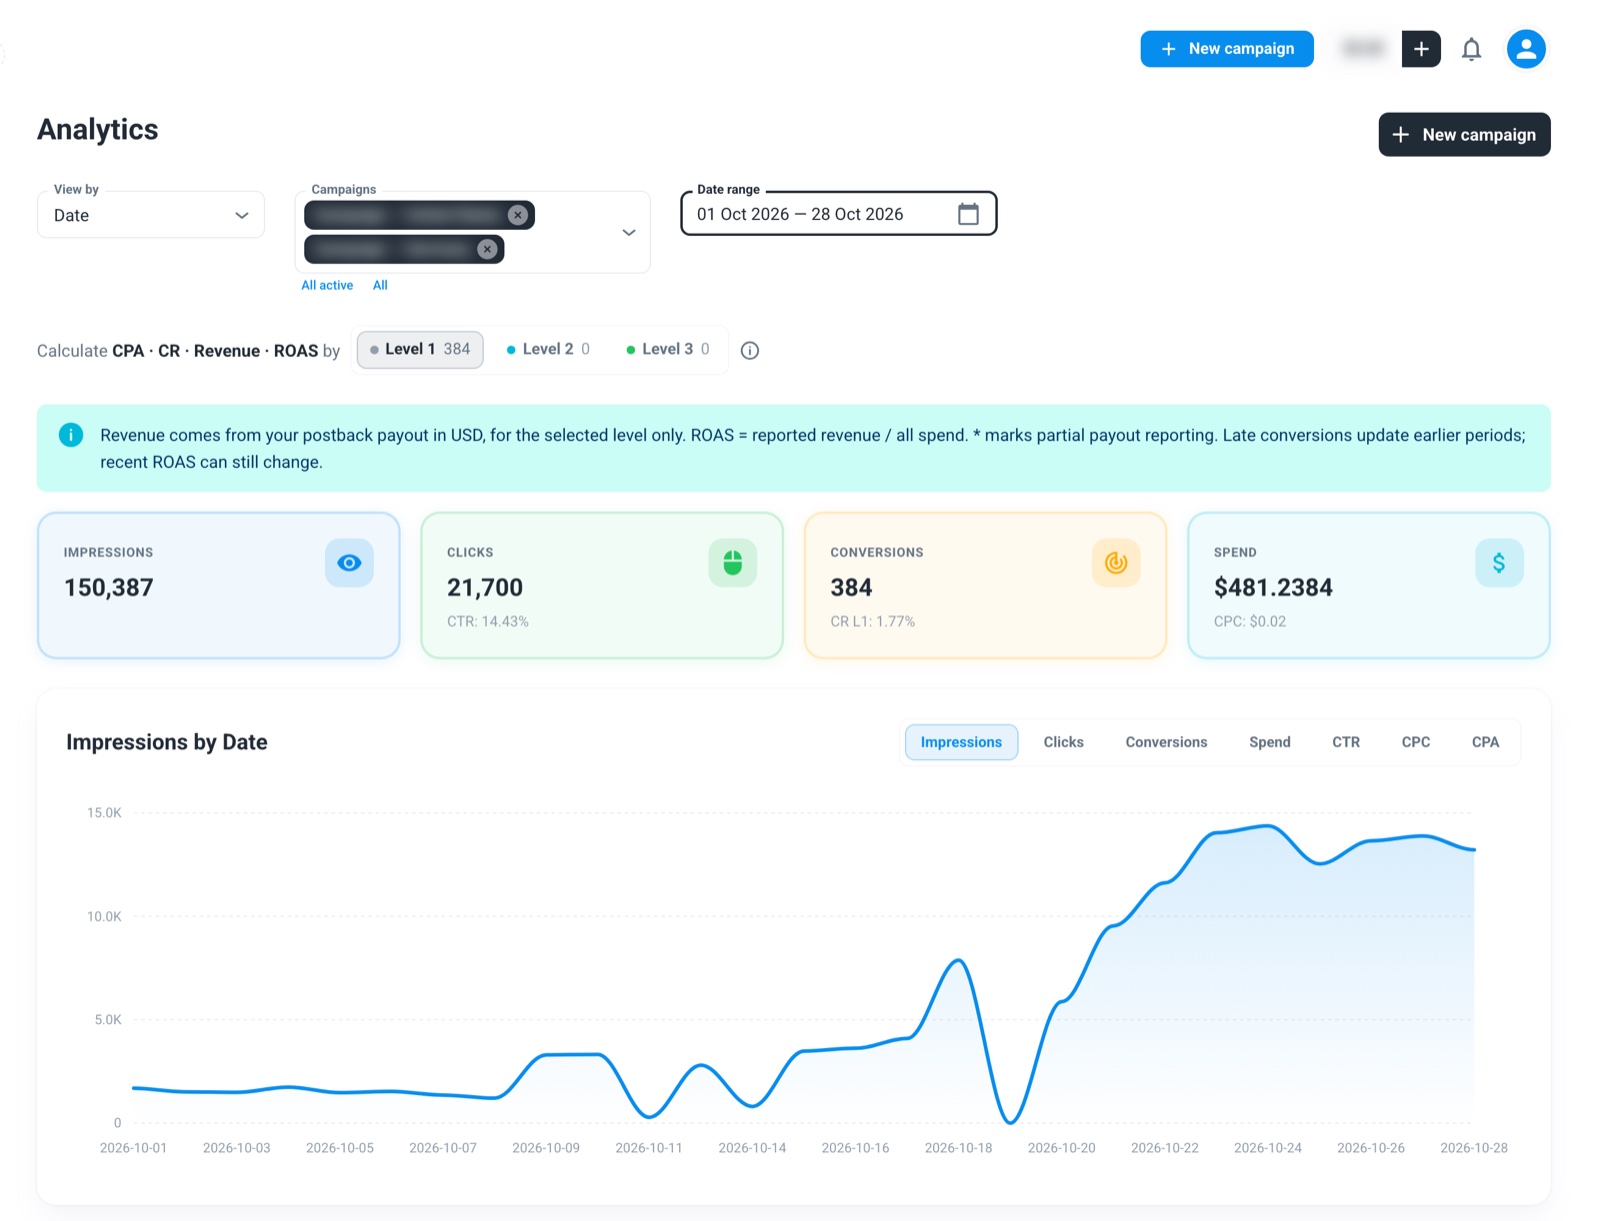 Analytics by date: daily impressions over the month. The dips are days with little or no delivery: October 11–14 and October 19.
| Week (from) | Spend | Impressions | Clicks | CTR | Conversions | Click → conversion | CPA |
|---|---|---|---|---|---|---|---|
| Oct 1* | $20.59 | 6,433 | 2,074 | 32.2% | 35 | 1.69% | $0.59 |
| Oct 5 | $39.92 | 12,474 | 3,529 | 28.3% | 70 | 1.98% | $0.57 |
| Oct 12 | $72.62 | 22,694 | 4,797 | 21.1% | 82 | 1.71% | $0.89 |
| Oct 19 | $217.64 | 68,014 | 7,847 | 11.5% | 132 | 1.68% | $1.65 |
| Oct 26* | $130.47 | 40,772 | 3,453 | 8.5% | 65 | 1.88% | $2.01 |
* partial weeks: October 1–4 and October 26–28.
CPA went from $0.59 to about $2, and it would be easy to read that as “the traffic got worse”. It did not. Conversion rate per click stayed between 1.7% and 2.0% every single week. What fell was the click-through rate, from 32% to under 9%.
At a fixed CPM the arithmetic is simple:
CPA = CPM ÷ (1,000 × CTR × conversion rate)
With CPM and conversion rate flat, CPA moves inversely with CTR. The first weeks ran on a few placements where the video got clicked a lot; the extra volume came from a wider set of Mini Apps where users clicked less often but, once they clicked, converted just as well.
Where the conversions came from
- 145 placements delivered clicks during the month; 34 of them produced at least one conversion.
- The largest placement brought 19.7% of the clicks. No single source carried the result.
That spread is what makes the numbers trustworthy: 384 conversions from 34 sources is a pattern, not one lucky placement.
What to take from this
- Track the event you pay for. This advertiser’s postback is the only reason the table has a CPA column at all.
- Before you call a source bad, split CPA into CTR and conversion rate. Here the users were as good in week four as in week one; only the price per click changed.
- Video works in Mini Apps. A 14% blended CTR is what makes a $3.20 CPM land at two cents per click.
- Scale with a cap on CPA, not on CPM. The next step for a campaign like this is to keep the converting placements and let Auto CPA bid them toward a target, instead of buying every new impression at the same flat price.
Numbers are pulled from Adexium’s production data (impressions are sampled and weighted; clicks and conversions are counted one by one). This is one campaign’s outcome, not a typical result or a performance guarantee.